Bangkok land prices decline in 2nd quarter
Partly attributed to economic slowdown
- Published: 31 Jul 2025 at 05:54 0 comments
- WRITER: Kanana Katharangsiporn

Several land plots advertised for sale in Soi Suan Phak in Bangkok's Taling Chan district. The price index for vacant land in Greater Bangkok fell in the second quarter of 2025 after two consecutive quarterly increases. Chanat Katanyu
The price index for vacant land in Greater Bangkok fell in the second quarter of 2025 after two consecutive quarterly increases, mainly attributed to the economic slowdown and the postponement of Bangkok's new city plan implementation to 2027.
According to the Real Estate Information Center (REIC), the vacant land price index in Greater Bangkok was 415 points in the second quarter of 2025, down 4.1% from the previous quarter.
The decline was partly driven by uncertainty over US economic policy, which has affected both global and Thai economic momentum.
Delaying the enforcement of Bangkok's fourth city plan revision from 2026 to 2027 also created more ambiguity over future land use, prompting many developers to postpone land banking decisions, noted REIC.
Land and building tax burdens have also raised landholding costs, leading some owners to gradually sell land to reduce expenses.
In response, some housing developers shifted investment to major regional cities and tourist hubs like Phuket, Chon Buri, Rayong, and Chiang Mai, causing land prices in Greater Bangkok to grow more slowly.
However, the year-on-year increase in Greater Bangkok's vacant land price index was 4.3%, down from a 6.2% rise in the first quarter.
Land demand in Bangkok's surrounding provinces remained strong, driven by new housing projects for middle- to high-income buyers, which has pushed land prices up.
The area in Muang Samut Prakan, Phra Pradaeng, and Phra Samut Chedi districts in Samut Prakan saw the highest land price surge year-on-year at 39.6%, especially along the Green Line (Samut Prakan–Bang Pu and Bearing–Samut Prakan sections).
The top five areas with the highest year-on-year land price growth were led by Muang Samut Prakan–Phra Pradaeng–Phra Samut Chedi, up 39.6%, due to continuous infrastructure expansion and convenient access to both the city and the Eastern Economic Corridor.
Second was Bang Kruai–Bang Yai–Bang Bua Thong–Sai Noi districts in Nonthaburi, with land prices up 38%. Third was Nakhon Pathom, where prices rose by 15.5%.
Fourth was Bang Phli–Bang Bo–Bang Sao Thong districts in Samut Prakan, up 15.4%. Fifth was Rat Burana–Bang Khun Thian–Thung Khru–Bang Bon–Chom Thong districts in Bangkok, with an 11% rise.
These changes reflected growing land demand in the outer zones, supported by motorway expansion and new mass transit lines.
In addition, land prices in these areas remained relatively affordable, making them attractive for low-rise residential development aligned with buyer affordability.
In contrast, available vacant land in the city centre was limited. Small plots carried high value, while mixed-use projects along mass transit lines had increased.
Developers holding land banks in the inner city locations have been delaying investment, waiting for market conditions to become more favourable.
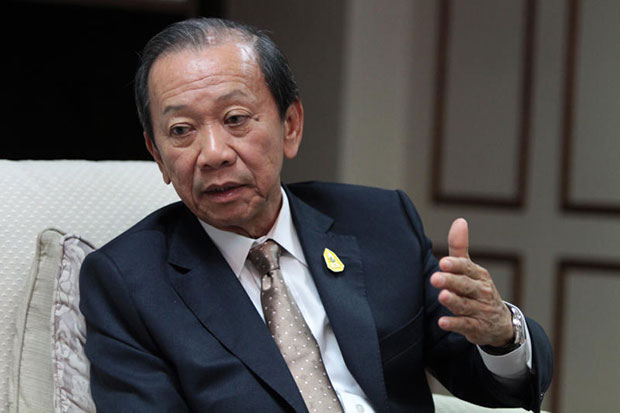
Some were divesting land to ease pressure from debenture repayments, which may not be easily refinanced amid unfavourable market sentiment, said Pairoj Wattanavarodom, managing director of SET-listed Eastern Star Real Estate.
In the second quarter of 2025, the top five mass transit lines with the highest year-on-year land price increases were mostly those already in operation or under extension.
Top-ranked were the Green Line extensions (Samut Prakan–Bang Pu and Bearing–Samut Prakan), both with 39.6% year-on-year growth and indices of 331 and 326 points, respectively.
The highest increases occurred in Phra Samut Chedi, Phra Pradaeng, and Muang Samut Prakan areas.
Second was the Purple Line (Bang Yai–Tao Poon), with an index of 489 points and a 10.1% year-on-year increase. Key areas included Muang Nonthaburi, Bang Bua Thong, and Bang Yai.
Third was the BTS Sukhumvit Line, with an index of 470 points and an 8.8% year-on-year increase. Major growth areas were Phra Khanong, Wattana, and Bang Na districts.
Fourth was the Yellow Line (Lat Phrao–Samrong), with an index of 425 points and 8.5% year-on-year growth. Key growth areas were Wang Thonglang and Suan Luang districts.
Fifth were the MRT Blue Line and the Dark Red Line (Bang Sue–Hua Lamphong), with indices of 603 and 594 points, respectively. Both saw a 7.9% year-on-year land price increase, notably in Wattana and Huai Khwang districts.


0 people commented about the above
Readers are urged not to submit comments that may cause legal dispute including slanderous, vulgar or violent language, incorrectly spelt names, discuss moderation action, quotes with no source or anything deemed critical of the monarchy. More information in our terms of use.
Please use our forum for more candid, lengthy, conversational and open discussion between one another.
Click here to view more comments